
Videos Uploaded
Avg. Videos / Month
Avg. Views / Video

Uncover the message hiding in a crowded slide
View Stats
Is your bar chart grouping hiding the insight?
View Stats
I gave 4 AI tools the same graph—with & without storytelling with data principles
View Stats
How to Create a Panel Chart with Just ONE Chart #DataVisualization #Excel #ExcelTips
View Stats
3 ways to highlight what matters in bar charts #Excel #Shorts
View Stats
The Biggest AI Mistake? Letting It Agree With You
View Stats
AI for Better Data Storytelling
View Stats
AI for data storytelling: better graphs, slides, and presentations
View Stats
How to create this eye-catching chart
View Stats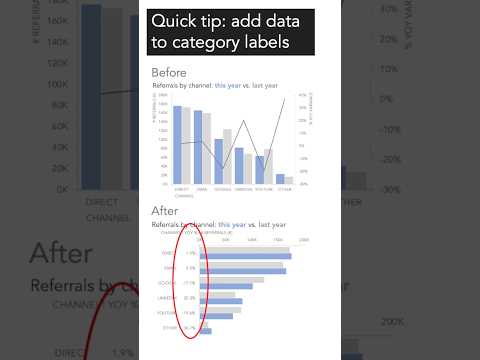
Show a second metric without cluttering your chart
View Stats
3 AI conversations for better graphs & slides
View Stats
3 ways to make timelines in PowerPoint
View Stats
Can AI tell a better data story?
View Stats
Data storytelling in the age of AI #shorts #datastorytelling #canvacreate #ai
View Stats
The mistake most analysts make #shorts
View Stats
Be careful using questions as slide titles (do this instead)
View Stats
Don’t stretch your graphs! #shorts
View Stats
Transform text-heavy slides into clean designs
View Stats
Create a partial shaded region #excel tip
View Stats
Use data series order to highlight what matters #excel
View Stats
Four ways to represent partial data clearly
View Stats
storytelling with data: celebrating a decade of data storytelling
View Stats
Go beyond decluttering and focus on the story
View Stats
storytelling with data turns 10!
View Stats
Go beyond decluttering and focus on the story
View Stats
Watch this presentation go from confusing to clear
View Stats
Win a signed copy of storytelling with you!
View Stats
A powerful data presentation from our new book
View Stats
before & after: storytelling with data mini-workshop
View Stats
Win a signed storytelling with data book!
View Stats
Win a copy of storytelling with data!
View Stats
Inside a storytelling with data workshop: REAL reviews
View Stats
Transform a typical business slide into a powerful data story
View Stats
transform: a storytelling with data mini-workshop
View Stats
Turn a dashboard into a data story!
View Stats
Create better legends in your charts: 3 dataviz tips in 30 seconds #dataviz #excel
View Stats
From charts to chocolate: SWD team offsite at Melt Chocolates London
View Stats
Never use a default legend again! #excel
View Stats
Pre Selling Innovation How Fares Ksebati Launched an App Without an App
View Stats
Stop using default colors in your time series charts (3 tips in 30 seconds) #datapresentation
View Stats
How does AI fit into data storytelling? #paworld
View Stats
Behind the scenes: final edit
View Stats
Pick a better palette with color harmonies: 3 dataviz tips in 30 seconds #dataviz
View Stats
Behind the scenes: our new book!
View Stats
Should I use EMOJIS in my graphs? | EP6 Where are your eyes drawn?
View Stats
Fast way to make better graphs #datavisualization
View Stats
Make your data stand out: highlight a value in a range #excel
View Stats
storytelling with data: #52 you asked...
View Stats
storytelling with data: #50 data viz research with Steven Franconeri
View Stats
storytelling with data: # 49: become a data viz superstar
View Stats