

Videos Uploaded
Avg. Videos / Month
Avg. Views / Video

Trust But Verify: Independent QA Checks for AI Analysis
View Stats
The Value of a Non-Traditional Education in Tech
View Stats
AI empowers analysts like never before
View Stats
How to Develop Business Acumen in 5 Easy Steps
View Stats
Analytical Thinking Is the #1 Job Skill (3 Years Running)
View Stats
Will AI Replace Data Analysts? (my honest take)
View Stats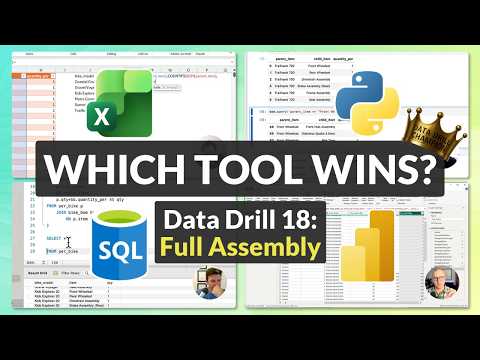
Which Tool Handles a Multi-Level Bill of Materials Best? | Excel vs Power Query vs SQL vs Python
View Stats
Free AI Training for Analysts: AI Analyst Week (Nov 9–12)
View Stats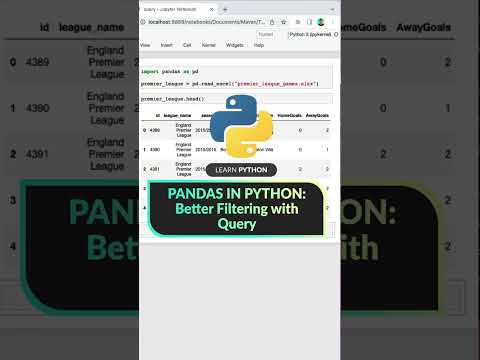
Pandas in Python: Better Filtering with Query #python
View Stats
dbt for Beginners | What the SQL code actually looks like
View Stats
Learn Excel: Measurement Conversion #excel
View Stats
Learn Tableau: Copy & Paste Sheet Formatting #tableau
View Stats
Design Dashboards Like a Pro with These 4 Layout Tips | Dashboards 101
View Stats
Learn Excel: Advanced Sorting #excel
View Stats
Learn Power BI: Forcing Grand Totals! #powerbi
View Stats
Appending vs Joining in Pandas: What’s the Difference? | Python for Beginners
View Stats
Learn Tableau: Dashboard Grid #tableau
View Stats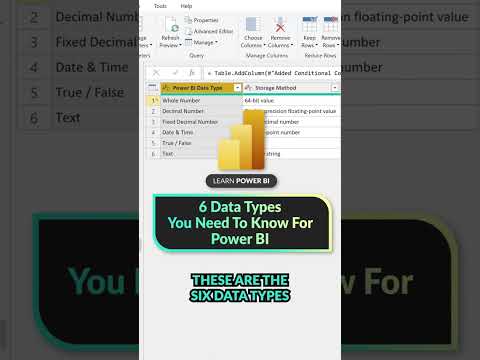
Learn Power BI: 6 Data Types You Need To Know! #powerbi
View Stats
Which Tool Calculates Weighted CTR Fastest? | Excel vs Power BI vs SQL vs Python
View Stats
Create a Heat Map in Excel! #exceltips
View Stats
Learn Python: Pairplots #data
View Stats
AI Governance for Business Leaders (NEW COURSE!)
View Stats
What Is a Dashboard? A Beginner's Guide to Data Visualization
View Stats
Learn Power BI: Best Charts to Use #data
View Stats
SQL to Excel via Python! #data
View Stats
Excel vs Power BI vs SQL vs Python | UTC Time Zone Conversion Drill
View Stats
Learn Tableau: Tooltip Editing #tableau
View Stats
Learn Excel: Star Ratings #excel
View Stats
Pivoting in SQL | Create a Summary Table with CASE and GROUP BY
View Stats
SQL for Beginners: How to Create a Table #sql
View Stats
Learn Excel: Number all your rows in less than 10 seconds! #excel
View Stats
Pandas DateTime Basics | Python for Beginners
View Stats
Comment While Coding With Python! #data
View Stats
Flash Fill in Excel #excel
View Stats
4 Common Data Visualization Mistakes and How to Fix Them | Data Visualization 101
View Stats
Visualize your data with Python! #data
View Stats
SQL For Beginners: Aggregate Functions! #data
View Stats
Excel vs Power BI vs SQL vs Python | Hospital 30-Day Readmission Rate
View Stats
Customer Segmentation Explained in 1 Minute! #data
View Stats
Create a quick stock market tracker in Google Sheets! #data
View Stats
Snowflake for SQL Users: Set This Up Before Your First Query
View Stats
Easily check your data for duplicates with COUNTIF( ) #excel
View Stats
Learn Excel: Filtering with the * Wildcard #excel
View Stats
Excel vs Power BI vs SQL vs Python | Analyzing Employee Survey Data (Data Drill #14)
View Stats
Learn Python: Get the First N Values of Each Group with .Head #python
View Stats
Build map-based visuals easily with the Plotly Express Library in Python #python
View Stats
SQL Window Functions | ROW_NUMBER vs RANK vs DENSE_RANK
View Stats
Learn Excel: Hiding Group Toggles
View Stats
How to Write SQL Queries with Google Sheets #sql
View Stats
Pivot Tables in Python | Clearly Explained
View Stats